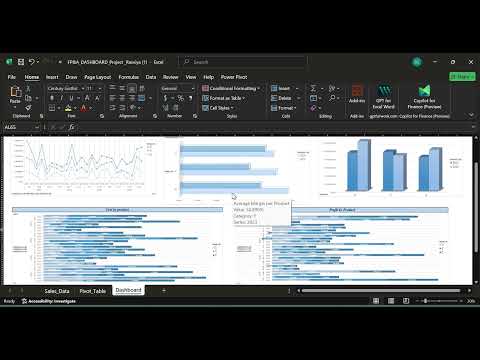
This project is a Product Performance Analysis Dashboard built in Microsoft Excel (Power Pivot). It visualizes 24 months of sales data (Jan 2023 – Dec 2024) and tracks KPIs like Revenue, Cost, Profit, and Profit % across products.
The dashboard is interactive and suitable for financial reporting, monthly product analysis, and stakeholder presentations.
This dashboard uses Power Pivot and Data Model features, which require:
- Microsoft Excel 2013 or later
- Desktop Excel app
Not supported in Excel Online, mobile apps, or older versions.
| File | Description |
|---|---|
Product_Performance_Analysis.xlsx |
Excel dashboard with slicers, Power Pivot, and KPIs |
Walkthrough Video |
Demo video of the dashboard |
Alternate Access |
OneDrive link |
Walkthrough video of the dashboard.
| Raw Sales Data | Pivot Table | Final Dashboard |
|---|---|---|
 |
 |
 |
- Microsoft Excel (Power Pivot, PivotTables, Slicers)
- Power Query for data shaping and transformation
- GETPIVOTDATA for dynamic KPI calculations
- Conditional formatting and interactive layout
- Units Sold
- Unit Price
- Cost per Unit
- Revenue
- Total Cost
- Profit & Profit %
- Product-level and monthly performance analysis
- Quick Decision-Making: Managers can identify high-performing or low-performing products instantly.
- Trend Analysis: Visualizes month-over-month revenue and profit trends to guide inventory and sales strategy.
- Profitability Insights: Highlights products with high cost but low revenue for optimization.
- Stakeholder Reporting: Provides ready-to-use visuals for presentations and board meetings.
- Operational Efficiency: Reduces manual reporting and consolidates multiple KPIs into one interactive dashboard.
- Financial data analysis and reporting
- Excel Power Pivot modeling and automation
- Dashboard storytelling for business users
- Time-series and KPI-based product performance analysis
Rasviya Sulthana
Aspiring Business Intelligence & Analytics Professional
Skills: Excel, SQL, Power BI, SAP Cloud ERP