Growth_Cone_Visualizer
Growth_Cone_Visualizer is a program that visualizes "Growth Cones diagram". It is programmed with the ImageJ software and it is presented in the form of an interactive graphical interface.
Growth Cone Visualizer Software is an imageJ-marco plugin that analyzes the morphological variability of neuronal growth cones.
In a biological context, neuronal growth cones are located at the end of axons. These highly mobile structures will navigate the nervous system under the control of external stimuli such as guide molecules to find their biological targets and form functional synapses.
The shape of the growth cone is highly dynamic to allow for growth, pause, and reversal events that occur in the axonal direction.
Indeed, this tool was developed to measure variations in the morphology of growth cones following various disturbances such as genetic mutations, exposure to external stimuli or to drugs.
GC-Visualizer is represented by three buttons (3 macros) in the imageJ taskbar, namely the: ?, d, b buttons as indicated by the following figure (Principal Graphical Interface of ImageJ:

-
Button ?: is the help software program (an url macro).
-
Button d: represents the variables menu options.
-
Button b: represents the main program of Draw Growth Cone Diagram.
By activating the "d" button by clicking on the right mouse button, we will have a window menu (as shown below) allowing the choice of plotting the baseline, the choice of the output image display color (image in RGB color or in grayscale), also the choice of the nature of the palette colors. The chosen color palette can be sampled linearly, affine or nonlinear (parabolic) in RGB mode.
Another button of this graphical interface gives the possibility to choose the sampling mode of the chosen LUT table.
In the same way, the button b allows the user to choose the program parameters (global variables). By default these variables are initialized. It also makes it possible to offer the possibility of choosing these own values if one wishes it (like the wish of a color palette given in the list proposed by Look Up Tables (LUT) of ImageJ).


It also offers the choice of the palette color such as the RGB table in LUT_RGB, LUT_RGB_Mode_Linear or nonlinear mode.
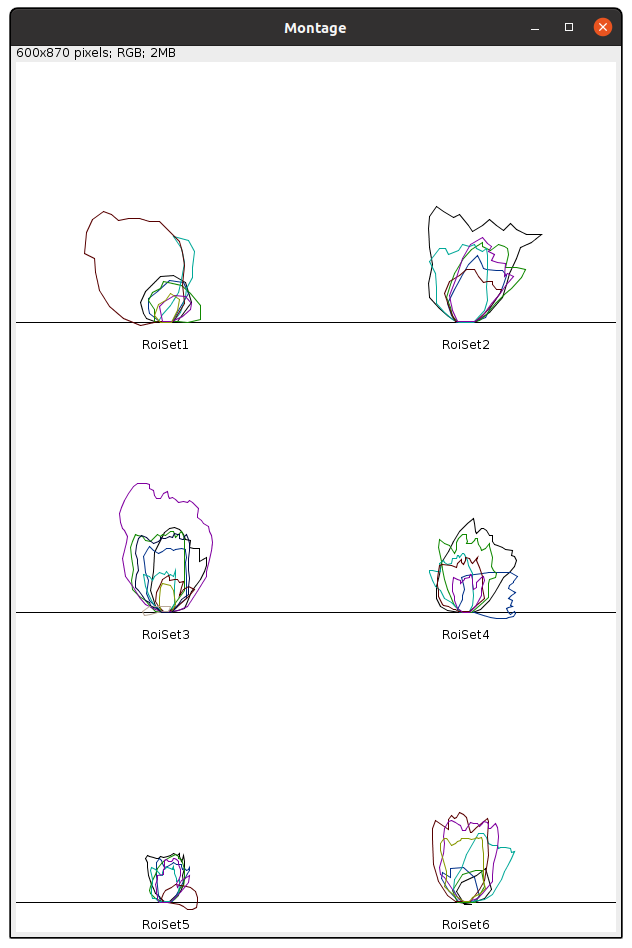
By activating the macro "b" located on the ImageJ taskbar, we obtain these results as indicated below
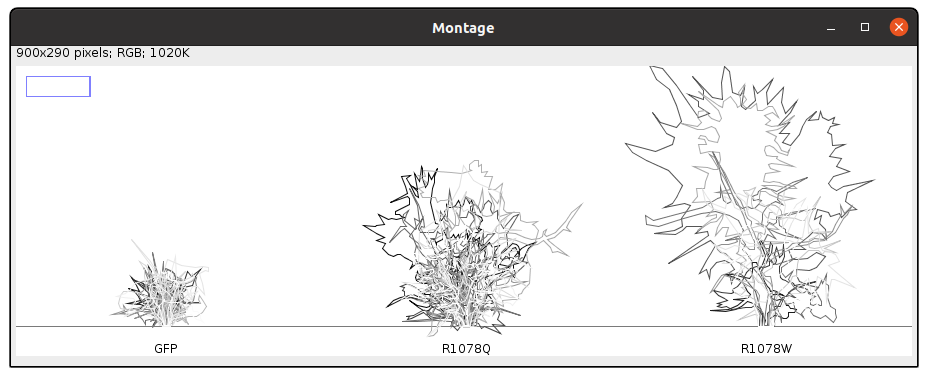
1/Result in Grayscale (Default) LookUpTable Mode:
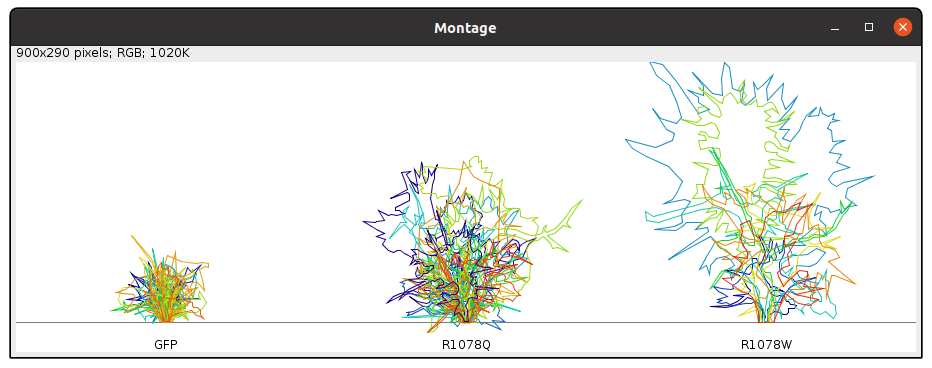
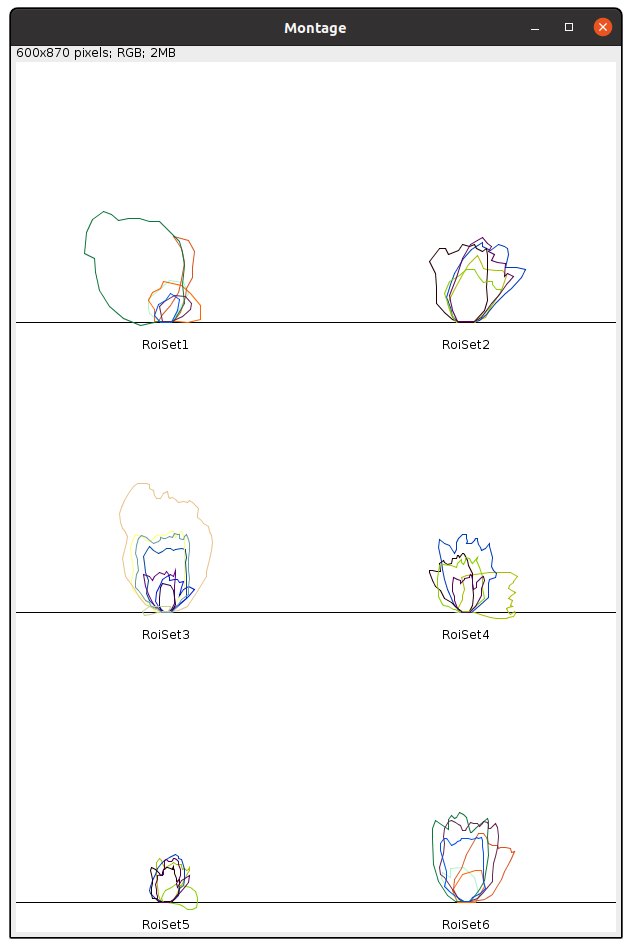
2/ Mode RGB LookTable with linear sampling:
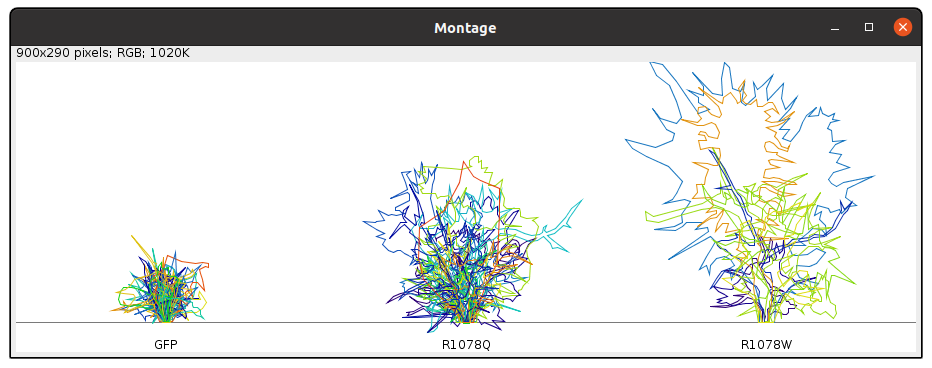
3/ Mode RGB LookTable with nonlinear sampling:
Remark:
Below we give some links indicating the main program and the selected contour data (ROI) on the Tulip image. These data are files in compressed format (* .zip) and can be downloaded
draw_growth_cone_diagram.ijm: main program
https://dev.mri.cnrs.fr/attachments/download/2478/RoiSet1.zip
https://dev.mri.cnrs.fr/attachments/download/2479/RoiSet2.zip
https://dev.mri.cnrs.fr/attachments/download/2480/RoiSet3.zip
https://dev.mri.cnrs.fr/attachments/download/2481/RoiSet4.zip
https://dev.mri.cnrs.fr/attachments/download/2482/RoiSet5.zip
https://dev.mri.cnrs.fr/attachments/download/2483/RoiSet6.zip
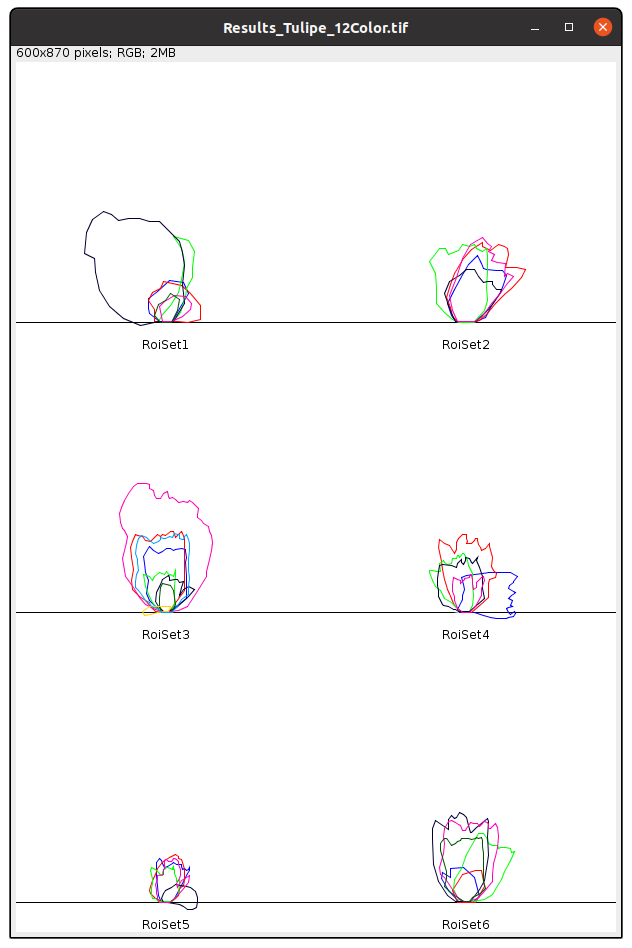
We also give the the obtained results for different color palette:
-RGB 12 colors:
-RGB LUT color:
-RGB color table with a linear sampling of RGB LUT table:
-RGB color table with a non-linear sampling of the RGB LUT table:
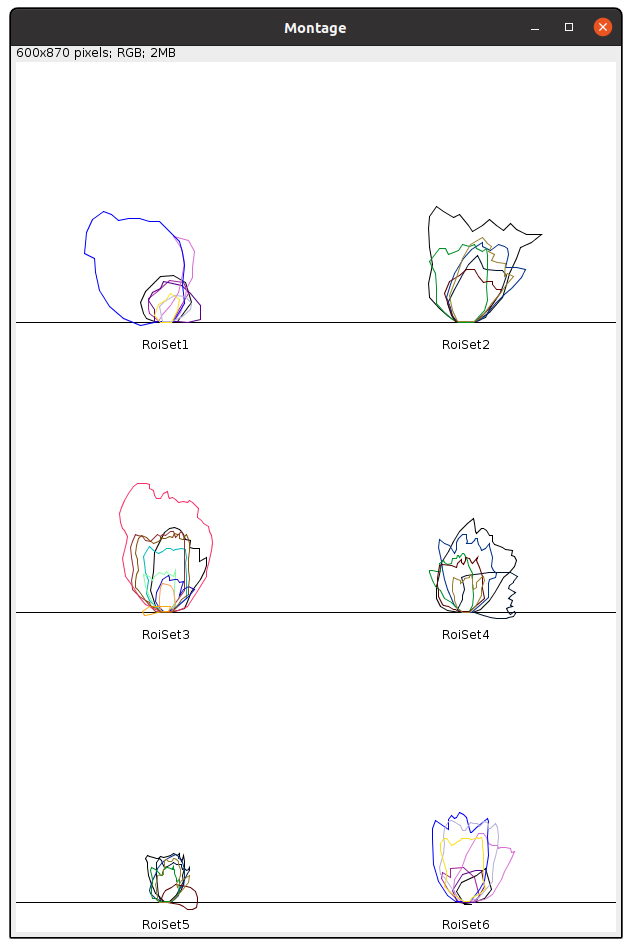
1/ we notice that the number of outlines of the detected ROIs depends on the sampling of the Look Up Table and the number of the interest ROIs for a given image.
2/ Note also that the linear sampling mode remains valid for sets of ROIs whose value or number is quite low.
 Volker Bäcker